Hi everyone, over the past year I have been trying to get a very numerical view of the Pokémon market. I would like to share some specific info on some market research conducted over time, feedbacks very welcome. And special thanks to @quuador on the feedback.
Edit: 1. Charts now include January, 2022.
2. Based on the feedback. CGC 8.5/PSA 8 and CGC 8.5/PSA 9 now available.
Since CGC has become a major player in the hobby now, a lot of discussions has been made over the grading strictness, mass production of 8.5s, crossing CGC 9.5s or even CGC 9s to PSA 10.
Now the question is: is there a way to compare their values? On average, price-wise, how does the market react to CGC9 compared to PSA9 overtime? We all know prices of CGC 10s are getting higher, but how much compared to psa 10?
And the ultimate question: most of us can feel the trend in the market, but can we have an exact numerical answer to those feelings.
Here is some insights: (if viewing on PC, open the pictures in another browser tab, will get the full resolution pictures.)
CGC 9.5 is in a very awkward position. Usually, it’s below the Price of PSA 10, but how much below? Comparing it to PSA 9, it has a higher chance to be mint, but what about the price between the CGC9.5 and PSA 9?
Here are some insights:
This is not financial advice. All data used are public information.
Let me know if there are any questions. Willing to share some more insights with the community. Happy collecting.
Edit: sorry got some big fingers with an iPhone 6, it happens. I corrected the ‘bellow’, lol
Impressive but a little complicated for me. What does all this tell you? Summary and conclusion.
PS…how can somebody as smart as you misspell “below” several times👀 JK😜
Good question, thanks for pointing out the ‘bellow’ lol, got some fat finger with a small screen… but I think it’s mainly my lack of IQ…
Well, I tend to not summarize things in the main thread so people can get a good point of view from their own.
Here is my personal thought:
CGC 9 vs PSA 9, price-wise, they are getting closer over time. Anything below 8, on average, PSA price > CGC price.
CGC 10 on the rise.
CGC 9.5 holds a very awkward position, some are PSA 10 qualities but almost half the price of PSA 10, but on average they are 30% above PSA 9 price. if people want to crossover, need to take at least 30% financial risk to get that 100% gain.
Summary: Anything below 9: PSA still holds the crown, but CGC is transforming into a very prominent competitor. if people only collect 10s, if there is a CGC 10 on the market, worth the extra price, otherwise just go straight to PSA.
Interesting stuff! How do you make these comparisons though? Are you comparing the average sale price of specific individual cards (e.g. a PSA 10 Illustrator Charizard to a CGC 10 Illustrator Charizard), are you comparing average sale price of any CGC 9 vs PSA 9, or something like total sales volume?
a) Did you sample a selection of cards, or the entirety of all sales containing the combinations mentioned of both PSA/CGC grades for a given card per day?
b) Where multiple sales occurred of the same grades on a given date, was an average price taken of all sales of the given card on the specified day, or was one selected by you (random, highest, lowest etc)?
3. Are you aware of the sampled data being better representive of a particular category of cards, such as modern over vintage?
Good question, not just one specific individual card. In my calculation, I used more than 25k cards to create the charts. If possible, can I have the permission to create another separate post on the sales volume/price analysis for the year 2021? I can give a more detailed explanation on that topic.
Yes, we can compare it for a single card, but the results will vary dramatically, for example, some cards CGC 9 will be 20% more than PSA 9. Of course, I cannot compare the price of the shadowless Charizard CGC 9 to any other cards like the Unlimited Blastoise CGC 9, it needs to be matched up. We need to have a higher-level view on the overall market. Simple way to think about this, like the S&P 500 Index. It shows the overall trend, but different card will have different behavior.
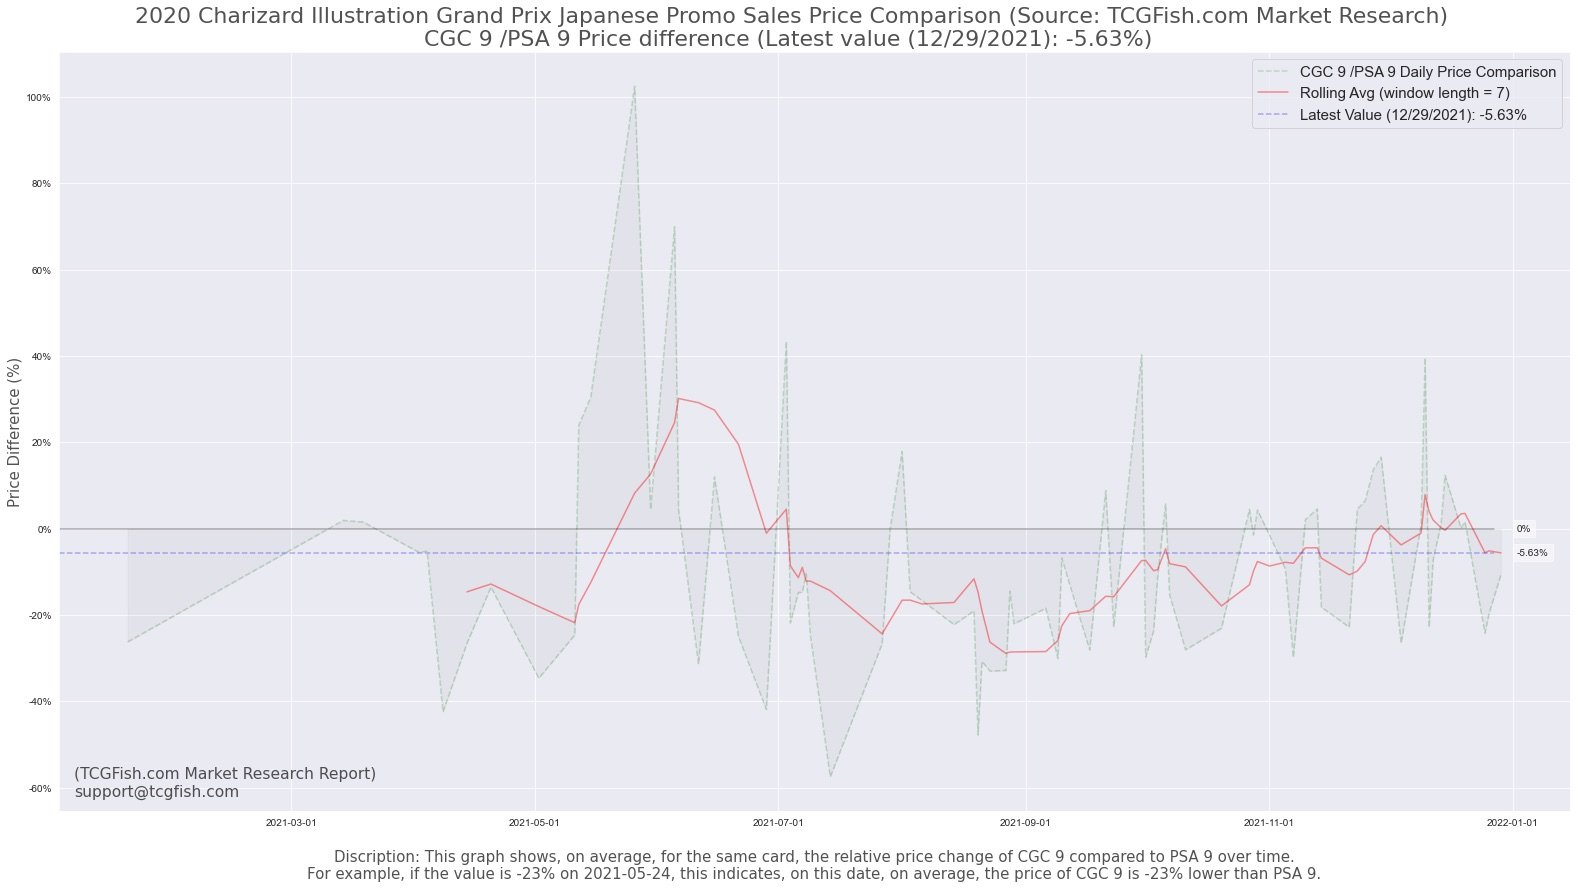
Back to the example you mentioned, CGC 9 /PSA 9 for the 2020 Illustrator Charizard Japanese promo, the latest moving average value I have on 2021-12-29 is around -5%, which indicates for this specific card, CGC 9 is 5% lower than PSA 9% on that date. But the big CGC9/PSA9 index is around -10%.
I only use publicly available information, like eBay combining 130point, I do not have any private sales. I do not use data from PWCC, I need to ask them first to get permission.
a) I created a collection of everything, all the sales. This is why it took a lot of time, massive task.
b) From my experience, average is the best way to keep things reasonable. We can select the low/high, but the market usually won’t fluctuate that much.
The chart contains all categories, I thought about this, but the other question is what year/set separates the modern/vintage? Is 2004 vintage enough to be vintage? Is 2013 modern enough to be modern? I just don’t have the IQ to do so.
Very good question, TCGFish.com will be available early March, 2022. It will contain all the Pokemon sales information for over 25k cards, both Japanese/ English, all the promos too, you name it, I have it. Not just PSA, it has CGC/BGS prices as well. It will also feature these Pokemon Data Analysis topics. I created a system from scratch, stayed tuned.
Ok, so if I understand correctly, the graph is made by aggregating comparisons between individual cards. You compare, for example, a CGC 10 Illustrator Charizard to a PSA 10 Illustrator Charizard, take that difference, and add it in as a data point. To get a new data point, you take another identical card (say a Kanazawa’s Pikachu), compare the grades, take the difference, and generate another data point. All data points are generated by comparisons of identical cards at a specific point in time.
Sweet, more questions. Since data points are made by comparing specific card sales, I assume you can only generate a data point when cards sell within a relatively close time frame. How long do you define the valid comparison period? How often is a valid data point generated, and how many points were you able to get to build the graphs?
Also, I think keeping things in one thread will be good, especially given the branding on your graphs and your support@tcgfish email, this looks very much like you will be trying to monetize things like this in the future (of which we do not allow explicit advertising on E4, but since it’s not built now, you’re good). Although, I would recommend at least buying the tcgfish.com domain before starting
Yes, exactly, this is an aggregation. In order to get the full picture, aggregation might be the only proper way.
Yes, the timeframe I have set up is 21 days, this is the time frame I used as the valid comparison period, we cannot set this too low, or too high, this value is a piece of art itself. It took around 500k points to build the graphs, so I’m sure it has enough points. Each graph takes at least 1 hour just to do the calculation. lol
Sorry about that, I added that as a watermark. Yea, got the domain and email ready, haha.
Sure, I’ll share some additional research info in the following days, would be very interesting.
Thank you for doing this researching, calculating it and displaying it for all of us to see and use.
I think there will be some people that will look at this and say that CGC = PSA overall. I think this line of thinking can be misleading for people that want to grade and are looking for a great return on their investment. I saw mentioned on Dan’s @gottaketchumall Youtube video that on average he feels like he’s getting a .5 to a whole 1.0 grade lower compared to what he would get when he sends to PSA. I’m anticipating his PSA & CGC returns experiment to see the deviation in grades of a fairly easily gradable card.
Correct me if I’m wrong, but it appears that CGC 9’s are earning less than PSA 9s by about 10%? That makes sense to me since it’s often more difficult to get CGC 9 and above. I graded several ex master sets and I was getting an mostly 8 to 8.5s. With PSA I was averaging a 9 with deviations of 8.5 and 10 being equal. My experience and opinion seems to mirror that of many experienced graders, including some members here, and that is that you’ll often receive a card that would be .5 to 1.0 whole grade lower in comparison to PSA or BGS. Even if the price gap at the higher levels is less, you have an even lower likelihood of receiving that grade. I think it’s great to have data to back up what you suspect is happening. Hopefully this doesn’t detract from the great post you’ve made.
As I promised, here is Research Report PART 2: Sales Price/ Sales Volume for the YEAR 2021.
I truly believe there should be an indicator of the overall market movement, other than the sales volume/total revenue. But unfortunately, it’s not possible right now. But the sales info does provide enough information to digest, at least for now.
I hereby present some insights for us to get a better view,
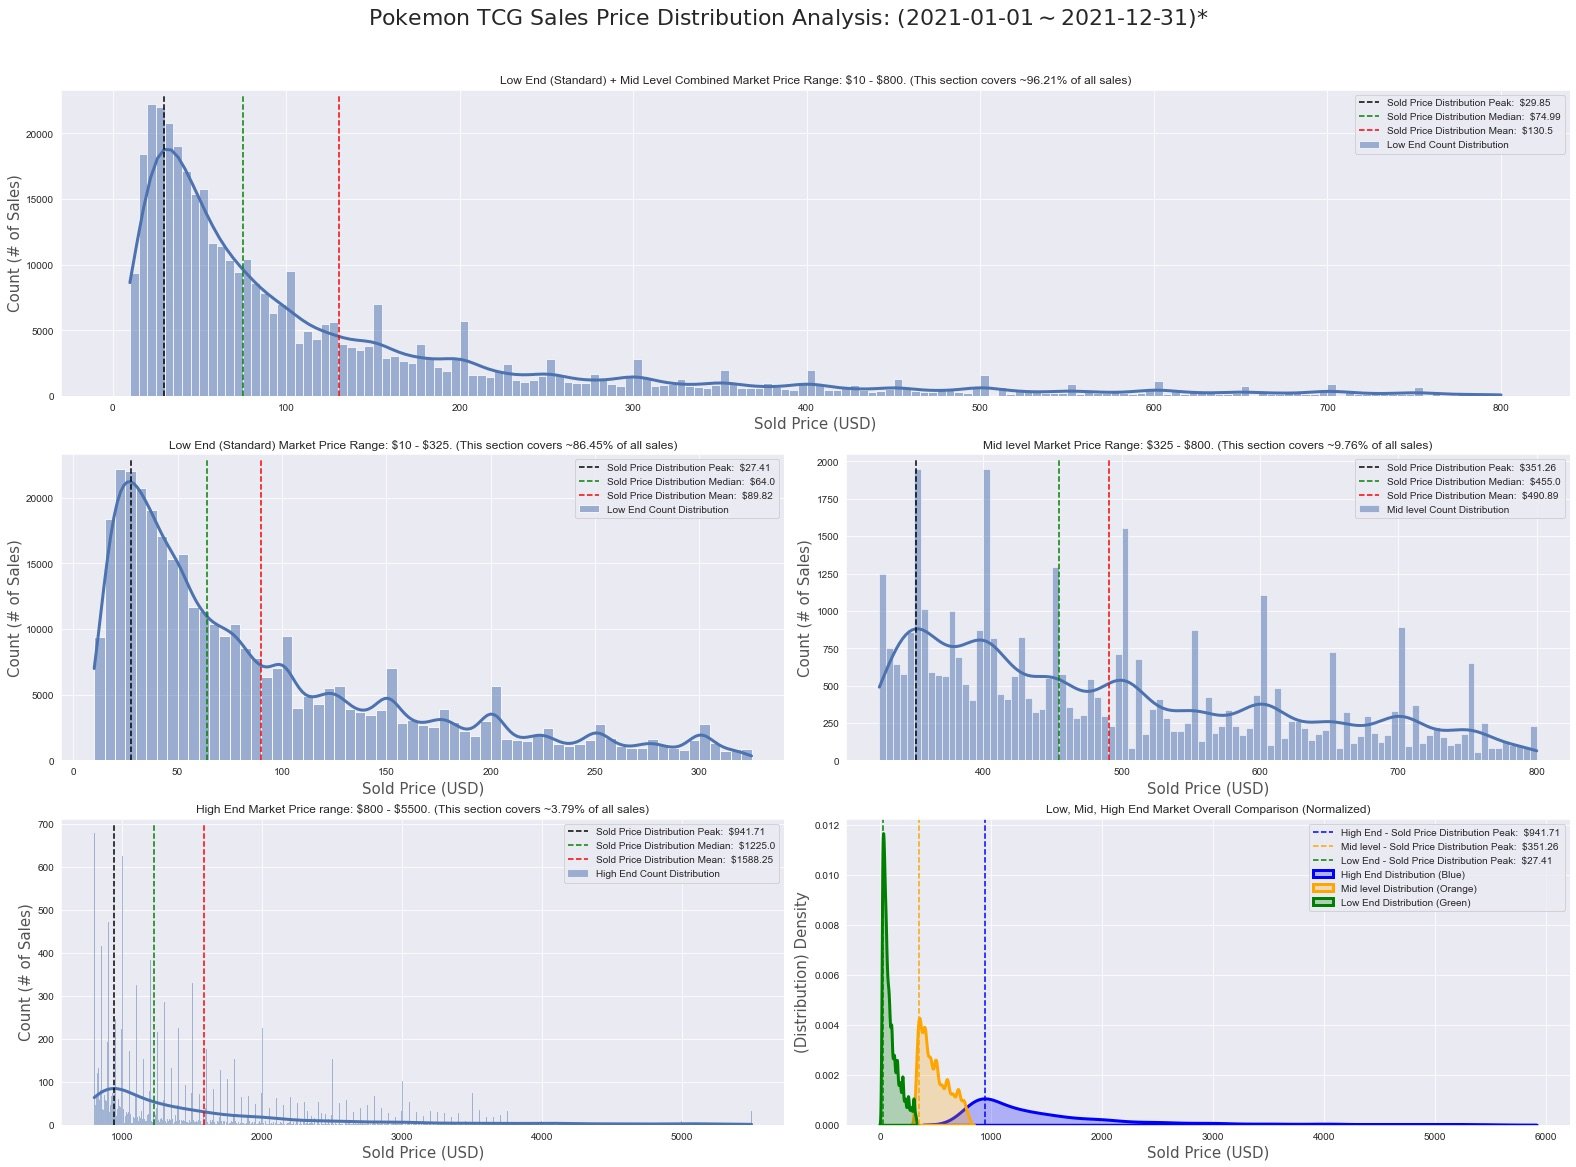
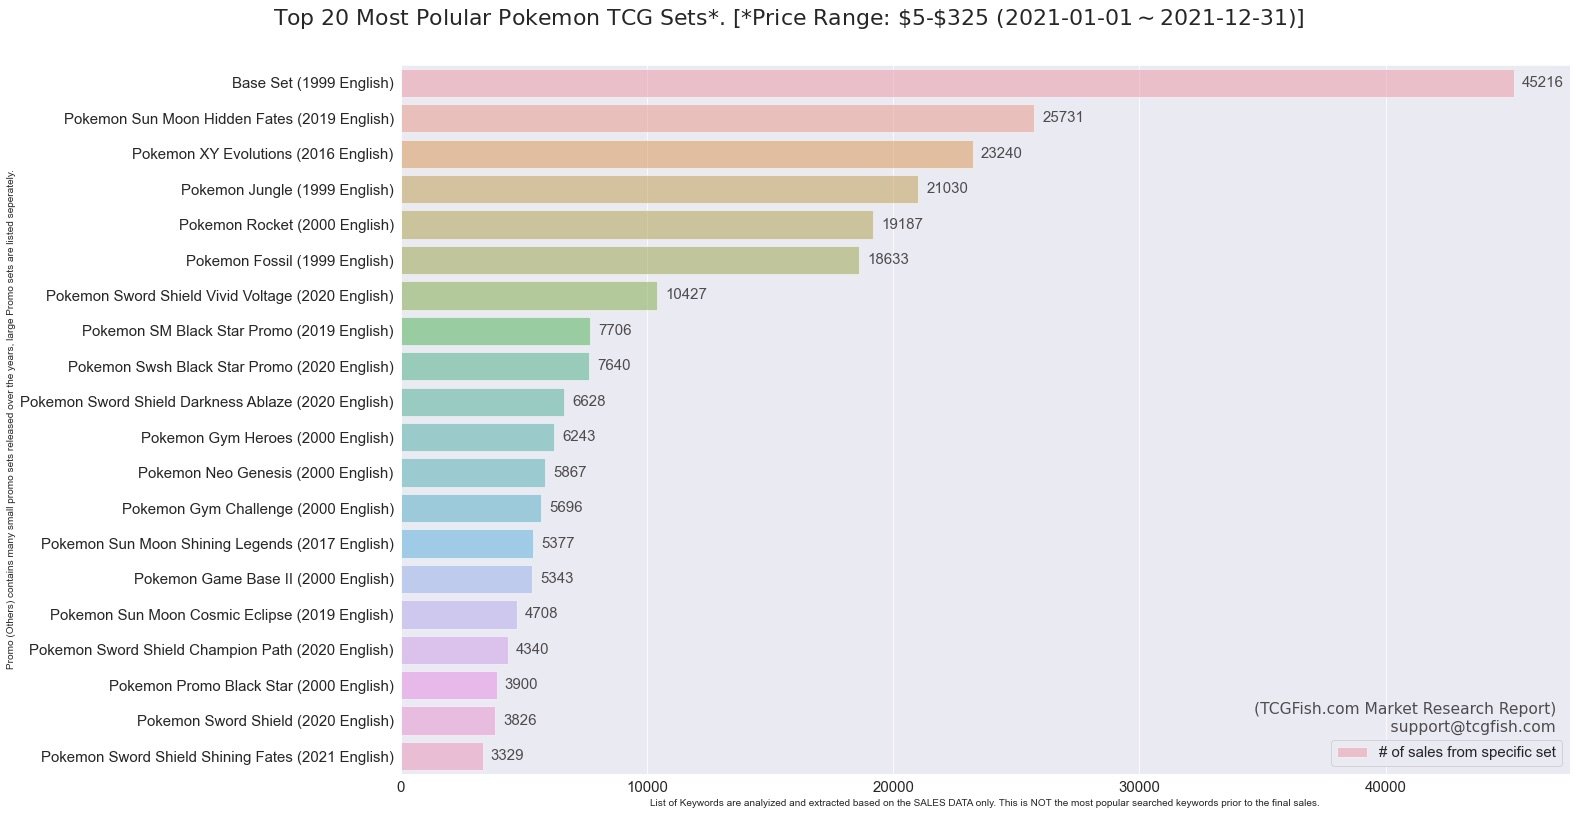
I separated the price into 3 categories: Low-range: $10-$325, Mid-range: $325-$800, High-end: $800+. I conducted some surveys, and this is the optimal numbers based on the feedbacks. In Market Report PART 3, I will explain in detail why we need to separate the price ranges, part of the reason is sales over $800 only consists 5% of total transactions but contributes to over 40% in total revenue.
Section 1: Sales Price
We first take a look at the sales distribution, nearly 95% of all sales are under $800. And the overall distribution peak (center of mass) lies around $27. Of course, if we dive into separate price ranges, they will have their own characteristic.
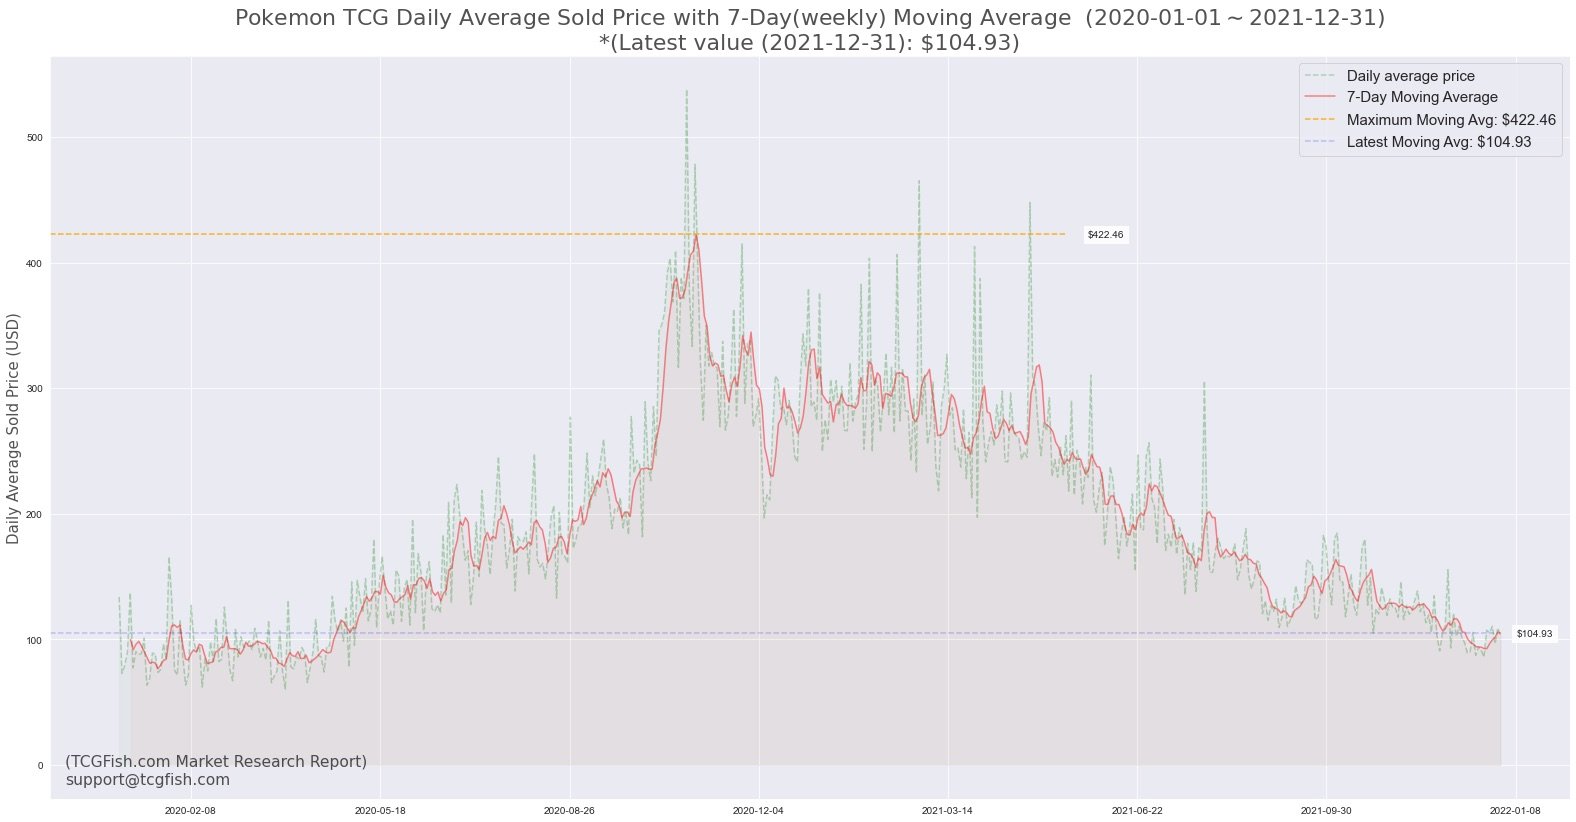
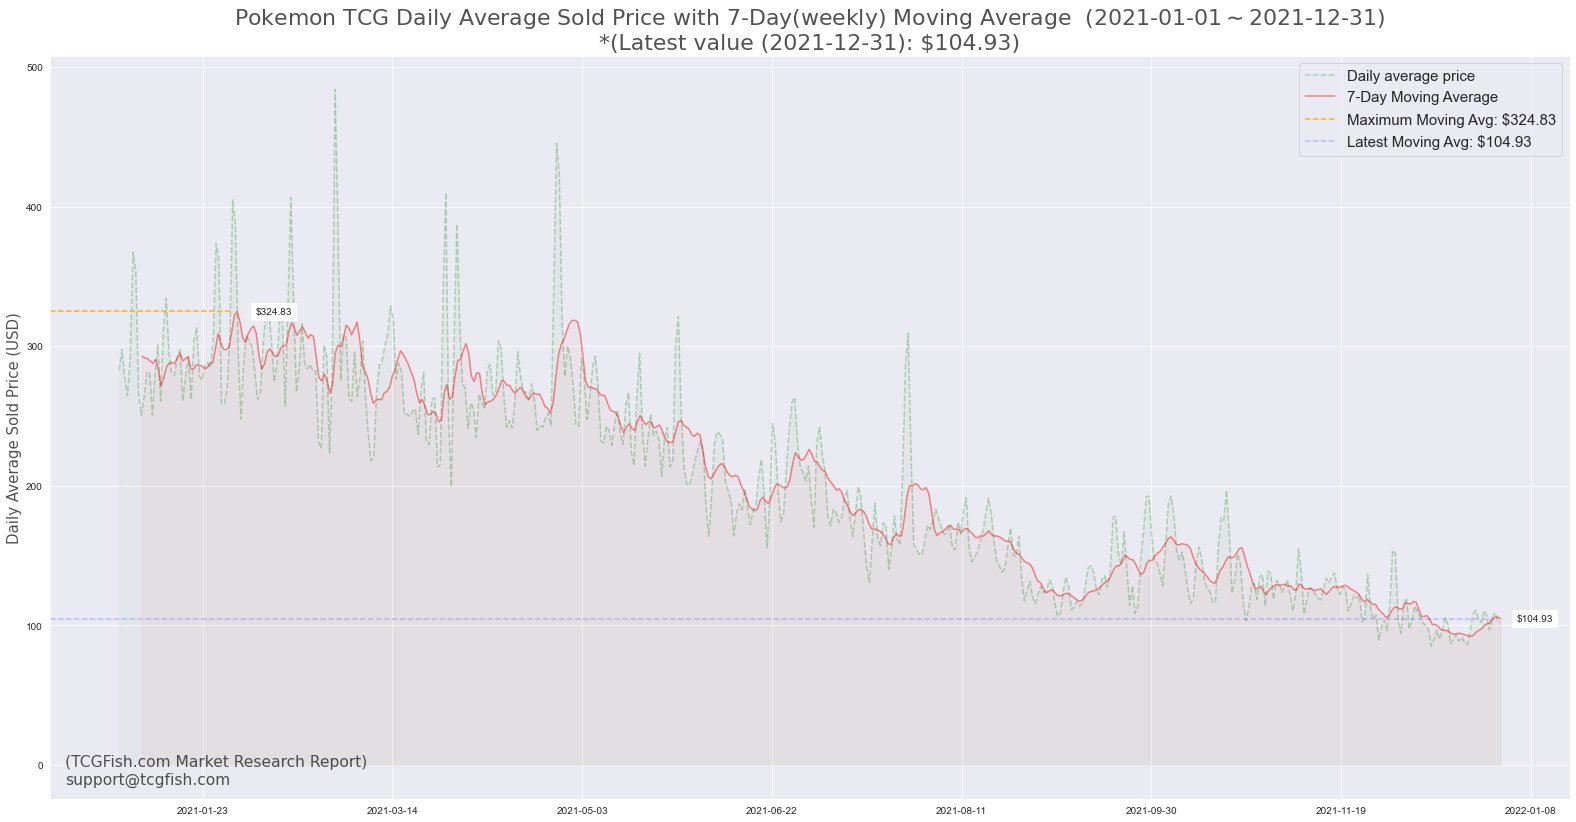
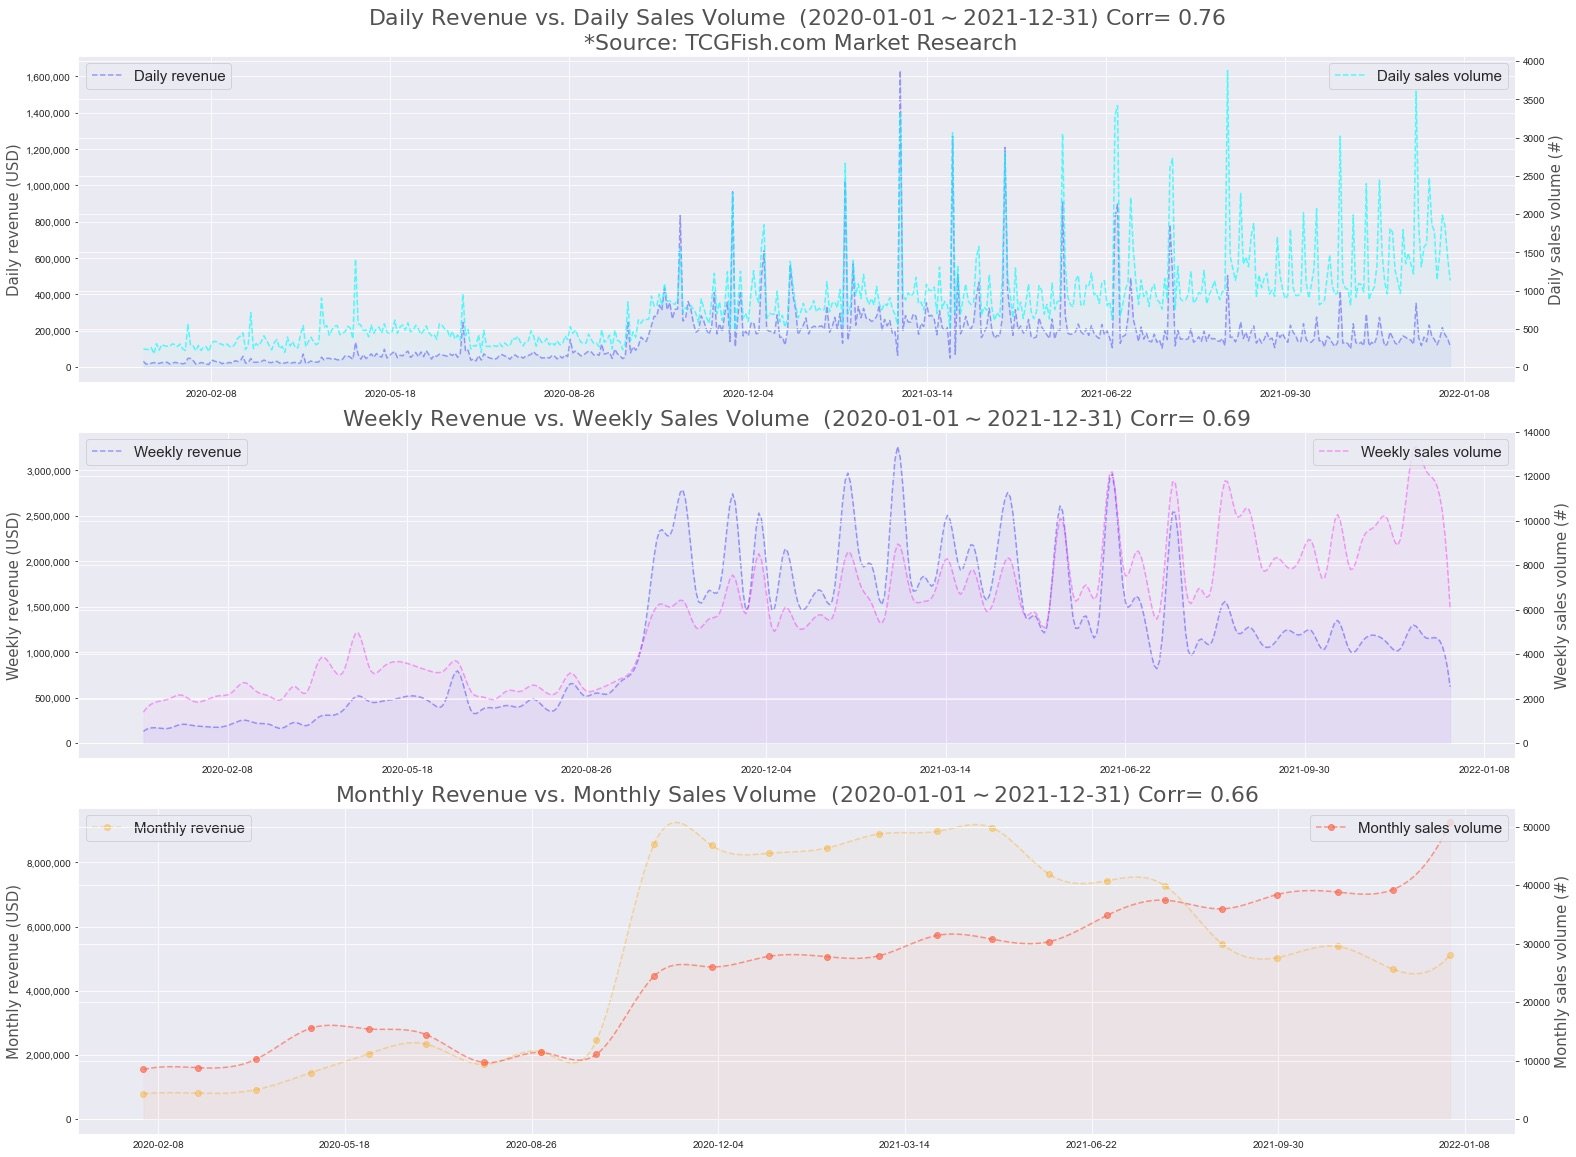
We also take a look at the AVERAGE sold price; this is a very important indicator. I couldn’t find anything like this in Pokémon TCG, so I created my own version. I hereby present 2 graphs, a) 2020-2021. b) 2021 alone.
Yes, average-price wise, we are matching pre-2020. As we can see for the YEAR 2021 alone, a strong down-trend. But we cannot simply make a conclusion we are now the same place as 2020. We also need to take a look at the total volume together, which introduces us to Section 2.
Lets focus on the 3rd monthly chart, since daily and weekly sometimes has too much volatility. As we can see, in late 2021, monthly revenue did remain stable, but the sales volume went up, very up, which leads to the AVERAGE Price lower, is it because too many slabs available on the market now? I don’t know. But we are definitely not at the same place as we are in 2020, sales volume in 2021 much higher.
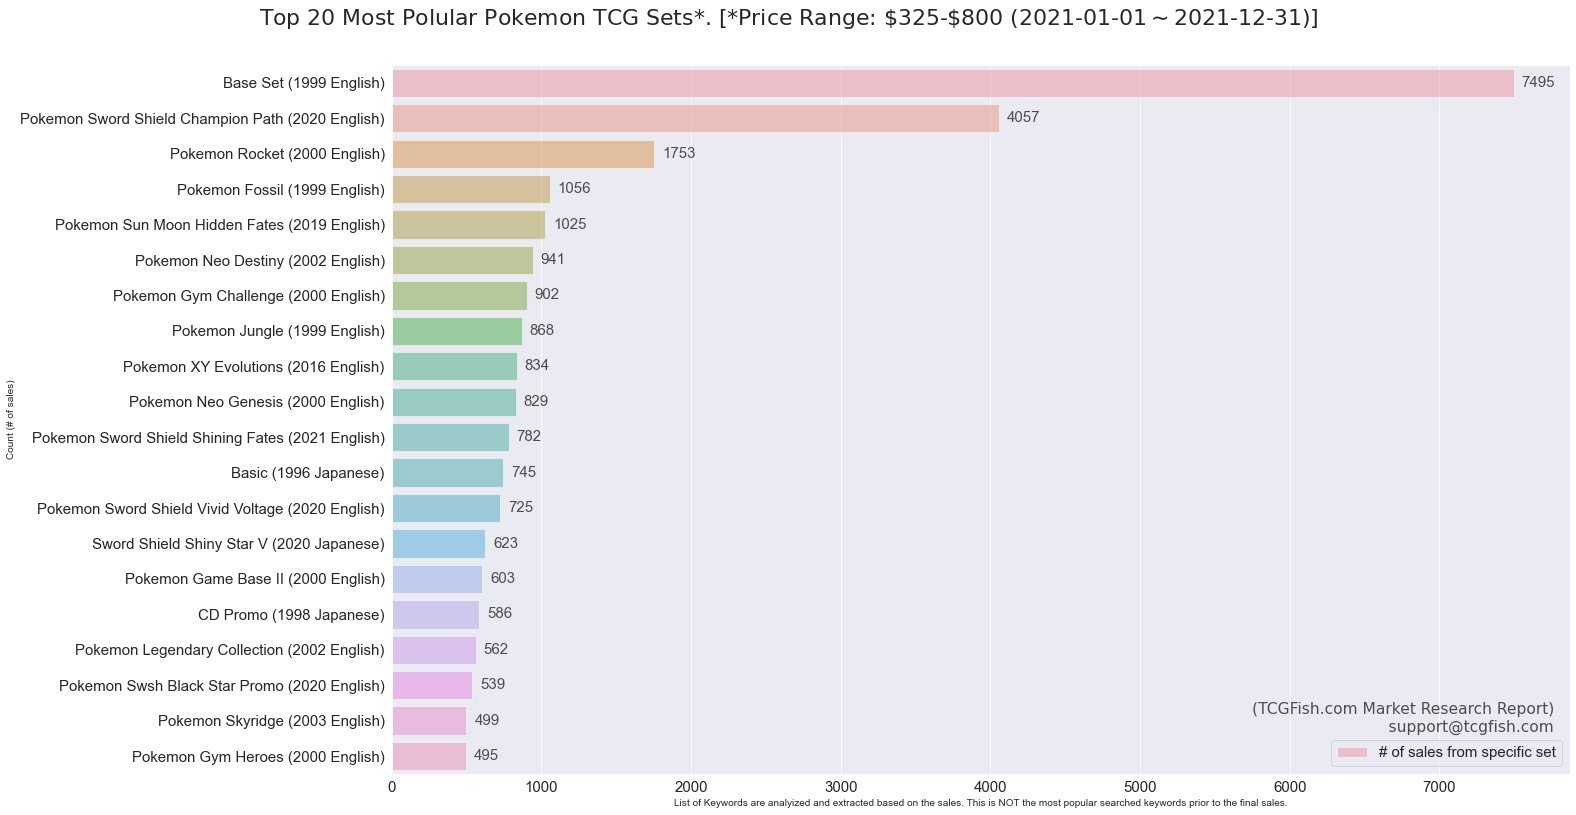
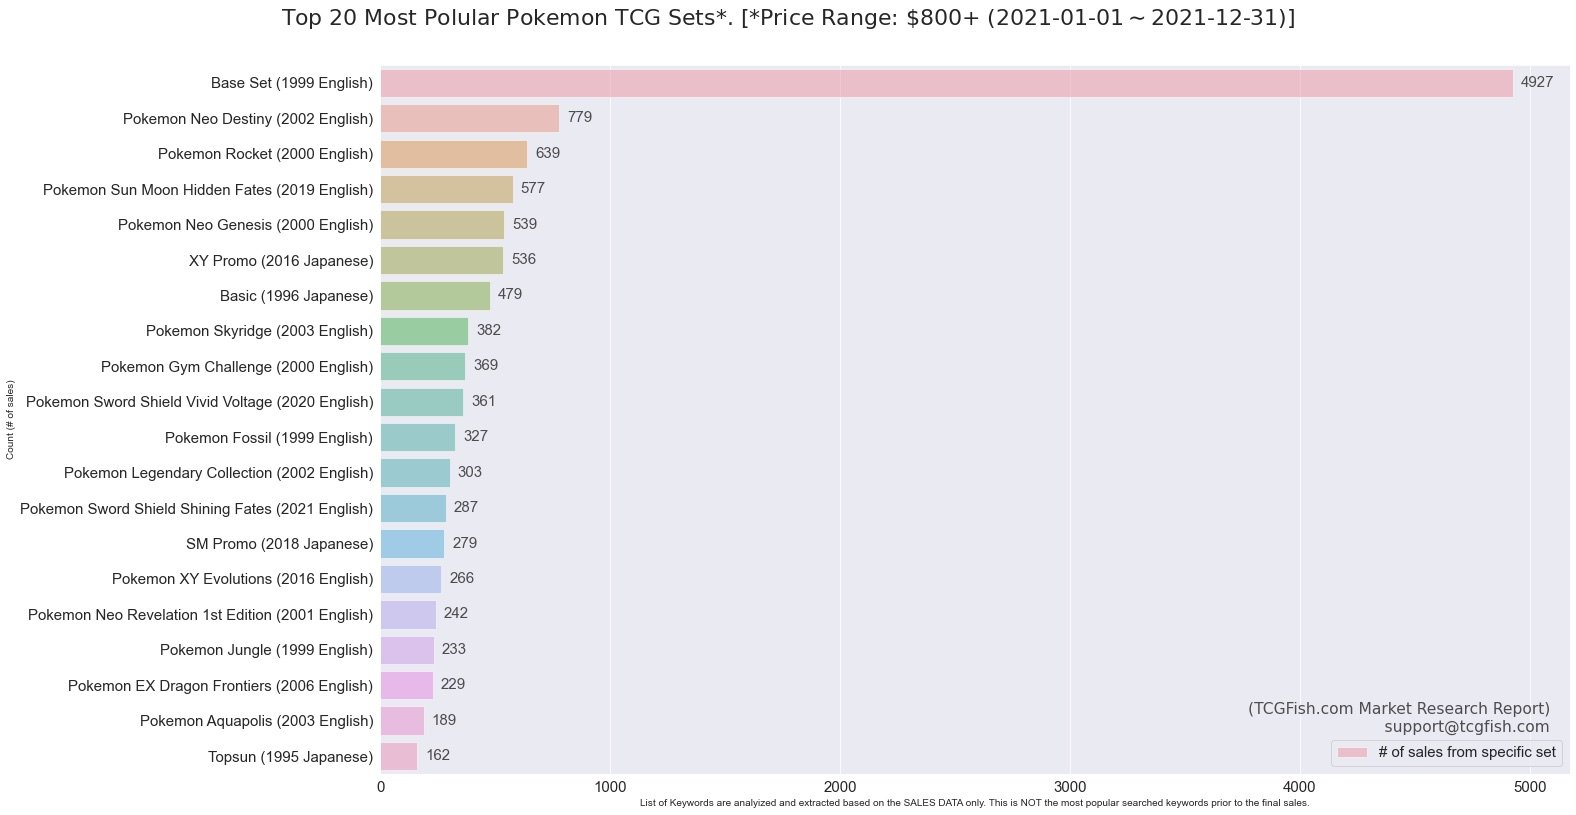
Section 3: Most popular Pokemon TCG set in 2021, TOP 20 for each price range.
Section 1: Segmenting the data by value ranges is great and we are seeing a lot of lower value cards being transacted (I say transacted here as opposed to sold as to not sound skewed towards everyone selling, as buyers were clearly out in droves too).
The average sold price indicator is quite nice to see.
I want to add a few comments here though, that while your dataset shows a large number of low value items, there is a bit of a survivorship bias here. Many, if not most high end items aren’t sold on ebay, and are through private sales or auctionhouses. So the data will of course be more representative of the lower end of the market. It’s just something to keep in mind. Additionally, you mentioned how heavily weighted the high end cards were to contributing to the Revenue amount. Well it would be prudent to remember that PWCC was banned from ebay and therefore all of their subsequent high end sales data has been presumably omitted from the dataset. So context is always important otherwise we end up with skewed data interpretations.
You use the term Revenue in your report, which over on pokemonprice is reffered to as Total Sales Value.
I only bring this to light as I will be referring to data from Pokemonprice in my discussion of your next section.
Section 2:
A few points of context:
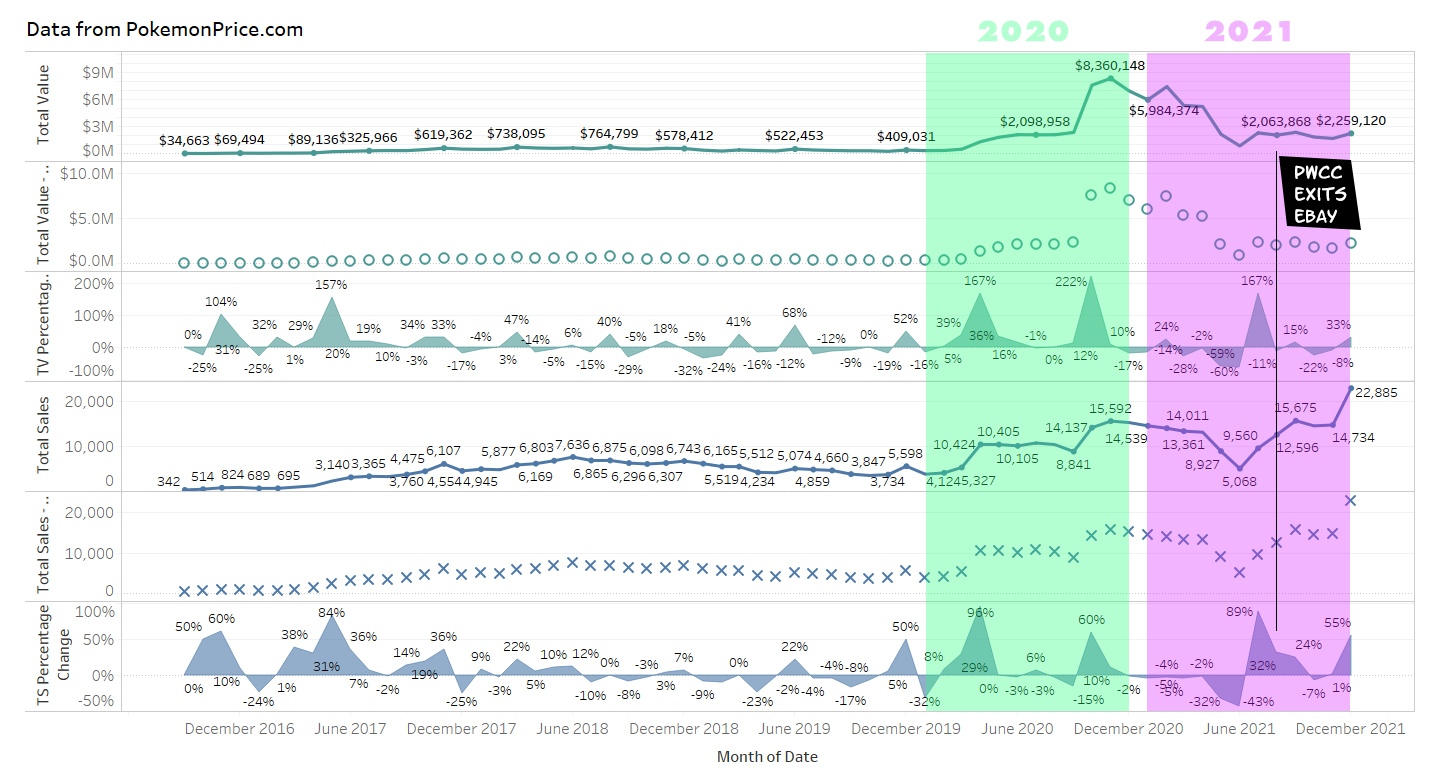
this lines up with where PWCC left ebay - in other words a great deal of the public high end sales were not reflected within the data for the 4th quarter of 2021.
CGC started grading pokemon in July 2020 (it’s important, because supply was really ramping up by all grading companies), meaning more was available to sell. It’s also important because grading companies other than PSA aren’t included in the data on pokemonprice which is where the following data is from.
Speaking of pokemonprice, I don’t know if @pierce adds sales data external to ebay. But on the surface it appears to exclusively record ebay sales.
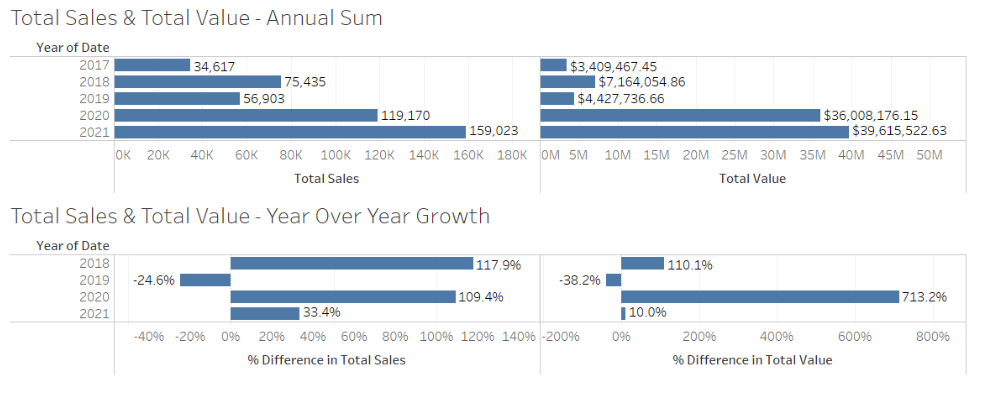
Using the pokemonprice API I can pull data for Total Sales Volume over Time, and can easily import this into Tableau to produce the following charts.
@tcgfish I would love to see the data you have recorded for your Annual Sums and YOY Growth (inclusive of course, of CGC and BGS).
In my next chart we can see the Total [Sales] Value, the intersection of years (Dec 2020/Jan2021), forms a close symmetry from one year to the next. Starting with a long tail of growth leading up to 2020, while 2021 slowly eases off. Again there is a myriad of contextual reasons to be cautious of placing too much importance on any particular indicators at the moment.
I do agree, we are seeing more sales and this really isn’t surprising to anyone at this stage, due to how many cards are being graded. But reading from the increased number of sales, it shows us they are being absorbed (met with buyers). Some at a lower price point, but certainly not all.
Are you by any chance recording listing numbers over time? Durations (time listed until sold) of buy it now listings would also be interesting to track.
It’s also important to remember that most sales within the hobby from back at the time of when pokemon price started recording data, were not for graded cards. As such is less representative of the market back then, other than as a measure of interest in graded cards. Whereas now a much, much, larger portion of the market is graded cards.
I for one look forward to your new project and wish you all the best.
Thanks. Yes, I’ve looked at the pokedata.io and pokemonprice and some other ones. Both are very nice.
I started gather info around 2019, so 2019 is the starting point. I do agree the PWCC ban did affect the charts, it’s a very unique situation that a mass number of cards sold in one day. Including a lot of high-end sales for sure.
Optimally, we can establish a place to gather all of the high-end private sales, this would be a fantastic idea. But sadly, I’m working on this project alone, this project is already a massive task. If there are any suggestions on how to collect private sales, would appreciate the help.
Like I said, I only use publicly available information. I would love to add PWCC sales info, but I need to contact PWCC and hopefully will get the permission to use their sales records. Right now, I do not have any private sales/ PWCC data. If we include all the high-end sales from PWCC, the average price might go up $10-$20, just guessing.
Regarding the sales volume and Total Sales Value, I can’t give you the full number, but I can share the info for 2021: Sales Value: 92M, which is a little bit higher than the data from Pokemonprice. In order to get the CGC/PSA Analysis charts, I used around 500k points.
Next one, I can’t record listing numbers or duration, this will require some official partnership with eBay to do so. I would love to, and I believe duration recording is technically possible. And I do agree, back in the days, things are different.
@wwweee, I just saw your website has launched, congratulations. I’ve only had a quick look so far but I just wanted to let you know I think it looks great.
When the “TA’s” enter Pokemon to this degree in combination IT scraping data and reporting graded pokecard trends, you know these boys are onto something that is inevitable - The upward trend of overall Pokemon cards (with heavy emphasis on the English cards)