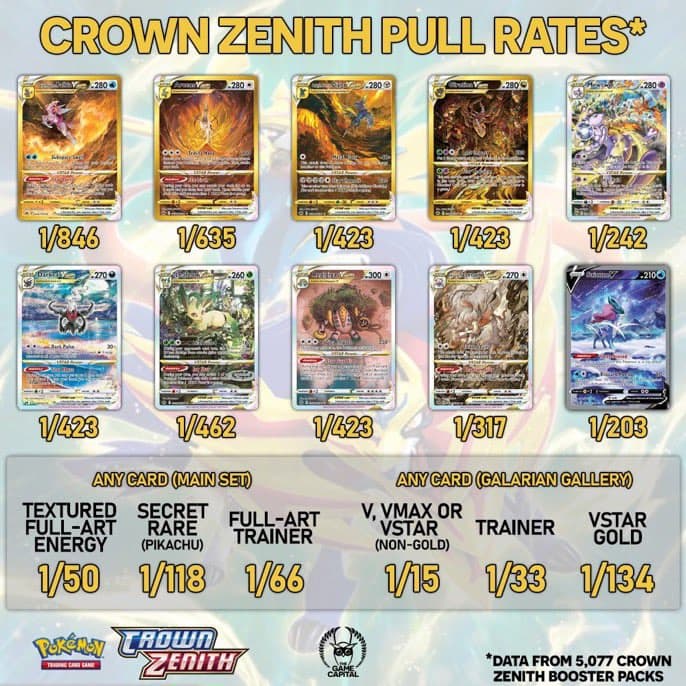
Crown Zenith dropped and wow! Palkia is rarer than both Pokemon God and Satan. And why is Suicune twice as common as Leafeon?? Something seems amiss…
Hold on one second.


Now 5077 packs might seem like a lot. But we are attempting to quantify the probability of rare events. How many of each card was actually pulled in these 5077 packs? It’s easy to calculate:
pull rate × total packs
| Card | Pull Rate* | Decimal | Pulled |
|---|---|---|---|
| Palkia | 1/846 | 0.00118 | 6 |
| Arceus | 1/635 | 0.00157 | 8 |
| Dialga | 1/423 | 0.00236 | 12 |
| Giratina | 1/423 | 0.00236 | 12 |
| Mewtwo | 1/242 | 0.00413 | 21 |
| Darkrai | 1/423 | 0.00236 | 12 |
| Leafeon | 1/452 | 0.00221 | 11.2[1] |
| Regigigas | 1/423 | 0.00236 | 12 |
| Zoroark | 1/317 | 0.00315 | 16 |
| Suicune | 1/203 | 0.00493 | 25 |
So we actually see between 6 and 25 of each card being pulled in this experiment. The infographic would suggest you need 211 more packs (on average) to pull a Palkia compared to an Arceus. But this is based on the difference between 6 and 8 pulls in 5077 packs.
What if by chance we pulled 6 Arceus and 8 Palkia instead? How much of these numbers are real vs entirely due to chance? Fortunately, statistics exists. We can model this experiment after a binomial distribution. This is just a fancy way of “pretending” like we redid this pack-opening experiment many times in order to get an idea of how much variability we should expect in the results.
Details if you are interested.
The binomial distribution with is a probability distribution of the number of successes in a sequence of independent experiments [2], each asking a yes–no question, and each with its own outcome: success [3] or failure [4]
Adapted from Wikipedia - Binomial distribution
Note: this makes an assumption about independent experiments. This is the same thing as saying that you cannot make a prediction about the next pack you open based on the last pack. It’s not a great assumption because if you’ve ever opened a box, you know there’s an expected number of hits. In other words, pulling a gold card in one pack means the chance of the next pack having a gold card is reduced (ie. not independent). There is also an effect with the case of boxes not being independent either. But if you were to buy multiple cases and open all the boxes and shuffled all the packs randomly, it would be more or less independent. Basically it’s not a horrible assumption to make.
In this case, we know how many packs have been opened (“trials” or “sample size”) and the number of each hit pulled (“successes”). What we want to find is the true pull rate. Because this experiment is affected by randomness, the can only take a best guess at what the true pull rate is. We can make a 95% confidence interval easily using online tools [5].
A 95% confidence interval is just defines a range based on the data we have. It accounts for the randomness in the experiment. Basically, there will be a 95% chance that the true pull rate is somewhere within this range. Let’s do an example:
6 Palkia pulled in 5077 packs. Our BEST ESTIMATE of the pull rate is 1/846 (0.00118).
The 95% confidence interval : 0.0005 - 0.0026 [6]
This means we are pretty confident that the true pull rate for Palkia is somewhere between 1/2000 and 1/385.
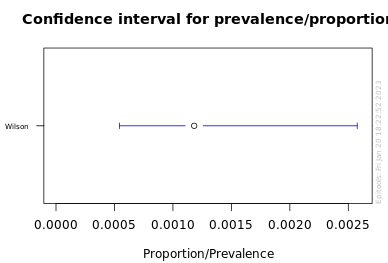
That’s a massive range and the “misleading” part of the infographic. The problem is that while 5077 packs is a lot, it’s not nearly enough to accurately quantify such a rare event.
In contrast consider the “V, VMAX OR VSTAR” rate of 1/15
339 V, VMAX OR VSTAR pulled in 5077 packs. Our BEST ESTIMATE of the pull rate is 1/15 (0.067).
The 95% confidence interval : 0.0602 - 0.0740
This means we are pretty confident that the true pull rate for V, VMAX OR VSTAR is somewhere between 1/13.5 and 1/16.6.
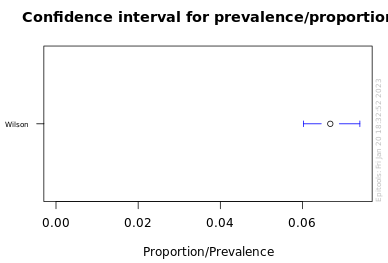
A far better estimate because the number of observed successes is a lot higher. Let’s calculate the 95% interval for all the special cards:
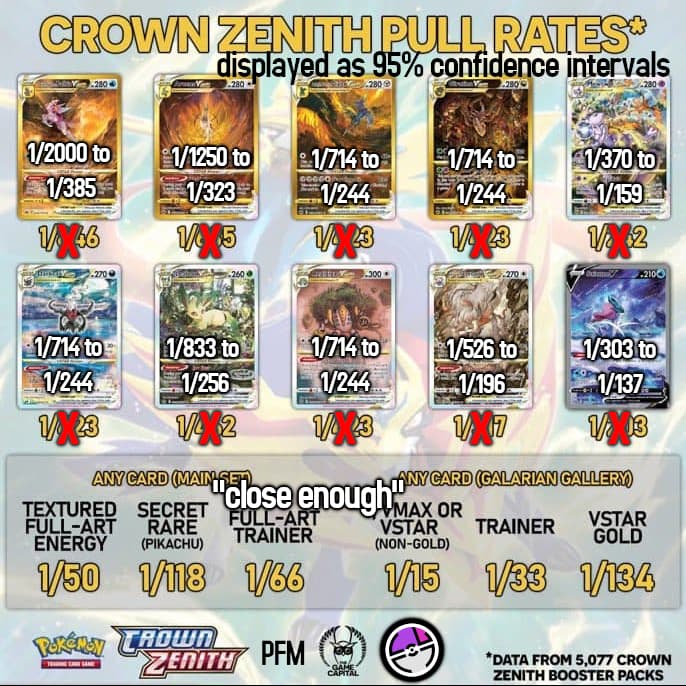
| Card | Pull Rate* | 95% CI | Range | ||
|---|---|---|---|---|---|
| Palkia | 1/846 | 0.0005 | 0.0026 | 1/2000 | 1/385 |
| Arceus | 1/635 | 0.0008 | 0.0031 | 1/1250 | 1/323 |
| Dialga | 1/423 | 0.0014 | 0.0041 | 1/714 | 1/244 |
| Giratina | 1/423 | 0.0014 | 0.0041 | 1/714 | 1/244 |
| Mewtwo | 1/242 | 0.0027 | 0.0063 | 1/370 | 1/159 |
| Darkrai | 1/423 | 0.0014 | 0.0041 | 1/714 | 1/244 |
| Leafeon | 1/452 | 0.0012 | 0.0039 | 1/833 | 1/256 |
| Regigigas | 1/423 | 0.0014 | 0.0041 | 1/714 | 1/244 |
| Zoroark | 1/317 | 0.0019 | 0.0051 | 1/526 | 1/196 |
| Suicune | 1/203 | 0.0033 | 0.0073 | 1/303 | 1/137 |
- Fun fact #1: All gold cards overlap between 1/714 and 1/385
– This means gold card pull rate could not be shown to be significantly different - Fun fact #2: All VSTAR cards overlap between 1/370 and 1/256
– This means VSTAR pull rate could not be shown to be significantly different - Fun fact #3: All gold cards and VSTAR cards overlap between 1/370 and 1/385
– This means gold cards and VSTAR pull rate could not be shown to be significantly different LOL
The TL;DR is that based on the data, the true pull rate between any individual gold cards and VSTAR could all be the same. The infographic is virtually uninformative yet it’s easy to leave with a very different impression. Here is a new-and-improved version of the pull rates.
Let’s be reasonable though. We can pull something informative from this by making simple assumptions. Let’s assume the pull rate across all gold cards are the same. And let’s assume the VSTAR also have a consistent pull rate. It’s not crazy to think since ultimately these cards are coming from sheets which will have a mostly uniform distribution of each card of the same rarity.
6+8+12+12 = 38 gold cards pulled
Which means the pull rate is somewhere between 1/97 - 1/182
21+12+11+12+16 = 72 VSTARs pulled
Which means the pull rate is somewhere between 1/56 - 1/89
This is evidence that the two types of cards actually have different pull rates (possibly due to there just being more different kinds of VSTAR). Either way, these ranges are a lot more meaningful. You have to buy ~150 packs to see a gold card and ~70 to see one of the VSTAR
There you go. Don’t trust these infographics at face-value. Appropriate estimations for exact cards require 10x the data than what’s given here - closer to 50,000 packs. That being said, you can still use these graphics to get a general idea of the pull rate across a class of cards